Tables and charts
📖 In short
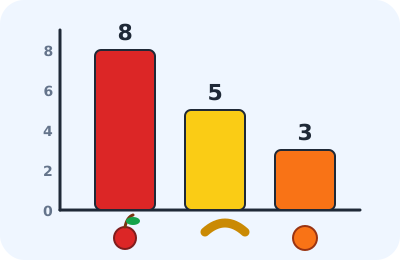
The teacher asked the class: “What's your favorite fruit?”. How can we quickly see which fruit won? We put the answers in a table, then draw them as bars: the tallest bar is the winner! This is statistics: collecting information and organizing it to understand it.
🤩 Did you know?
- The first censuses in history were carried out more than 5000 years ago in Egypt and Mesopotamia.
- The bar chart was invented by the Scot William Playfair in 1786.
- Most countries count their population about every 10 years.
- When most of the votes pick the same thing, we call it the “majority”.
🔎 Find out more
🌟 Collecting information
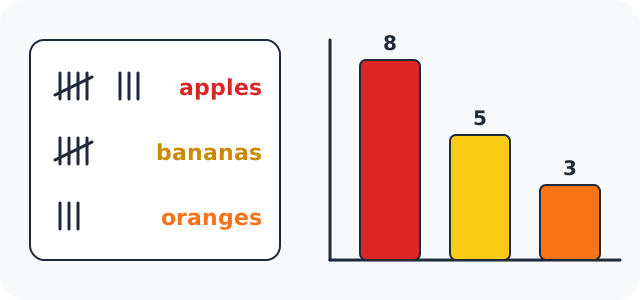
We ask a clear question, record each answer with a little tally mark, and group the marks in fives so we can count them quickly. Then we write the final number for each answer in a table.
🔍 Bar charts
For each answer we draw a bar as tall as its number. We write the names under the bars and the numbers up the side. At a glance we can see the most and the least.
💡 Average
If you got 7, 8 and 9 in three tests, your average is (7 + 8 + 9) ÷ 3 = 8. An average is one number that sums up several numbers, as if we shared the points out equally.
🎯 Everywhere
Doctors use statistics to understand people's health, farmers to know how much rain fell, schools to see results, and weather presenters to forecast the temperature.
📊 See it in a picture
🧮 Worked examples
- Apple 8, banana 5, orange 3The table: apple wins with 8 votes.
- (10 + 12 + 14) ÷ 3 = 12The average of three numbers.
📚 Key words
- Statistics
- The science of collecting, organizing and understanding information
- Chart
- A picture that shows numbers with bars or lines
- Average
- The total of the numbers divided by how many there are
🧪 Try it at home
Ask 10 people in your family and neighborhood: “What's your favorite color?”. Record the answers with tally marks, then draw a bar chart with colored bars. Which color won?
🧩 Test yourself
1 In a bar chart, the most popular answer is…
2 What is the average of 4, 6 and 8?
3 What is the science of collecting and organizing information called?